Uploaded image for project: 'Jenkins'
  1. Jenkins
  2. JENKINS-18915

JaCoCo green/red bar graphs at the project level under "Overall Coverage Summary" don't match percentages displayed

XMLWordPrintable

    • Icon: Bug Bug
    • Resolution: Fixed
    • Icon: Major Major
    • jacoco-plugin
    • None

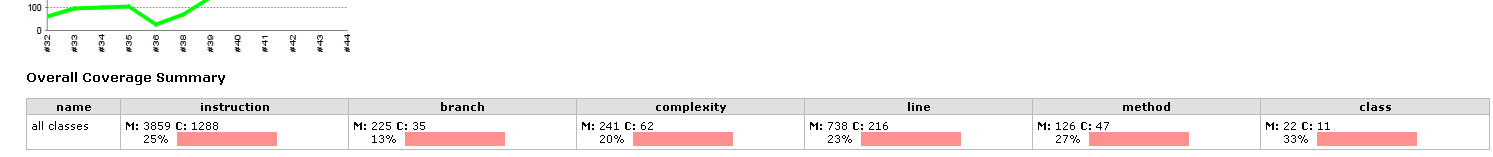
      When I go into a job and look at the coverage thermometers for all the packages in my whole project, the bar graphs under "Overall Coverage Summary" show all red, even though the percentages are not 0%. All other thermometers seem to work ok.

      See attached screenshot.

            Unassigned Unassigned
            frizbog1 Matthew Harrah
            Votes:
            0 Vote for this issue
            Watchers:
            2 Start watching this issue

              Created:
              Updated:
              Resolved: