-
Bug
-
Resolution: Incomplete
-
 Critical
-
Linux Server with 24 CPUs and 64GB RAM
Jenkins version LTS 1.509.4/1.532.1 on Jetty
Memory allocated for Jenkins/Jetty process: 42GB
Environment: Jenkins working with 600 jobs with high activities + 40 slave machines (Linux and Windows)
After Jenkins upgraded to LTS 1.509.4 from LTS 1.509.3 I notice that over time (24 hours) Jenkins becomes very slowly.
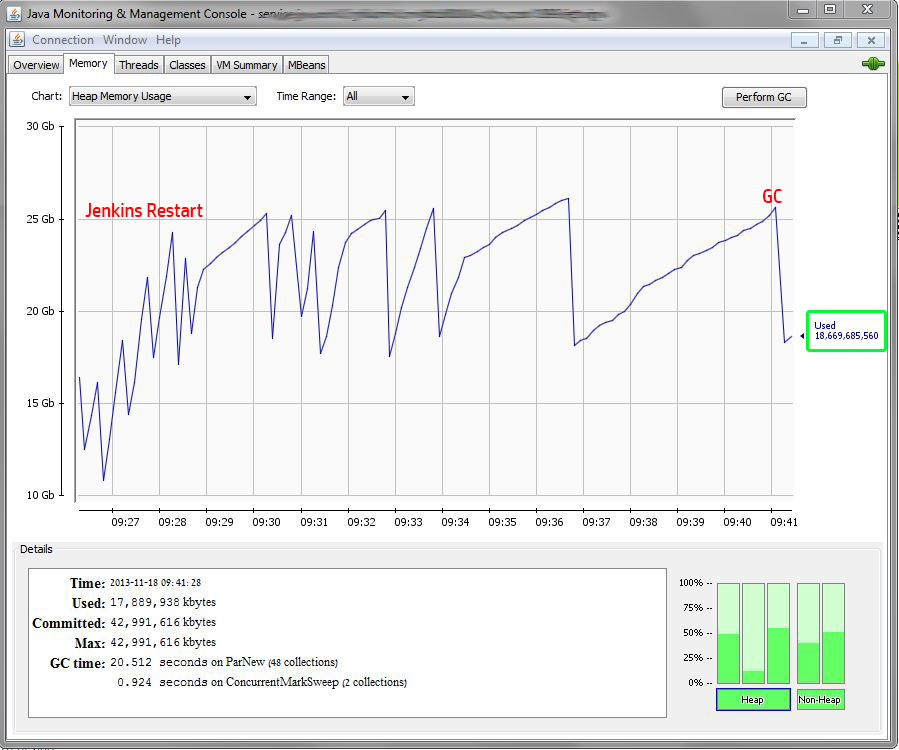
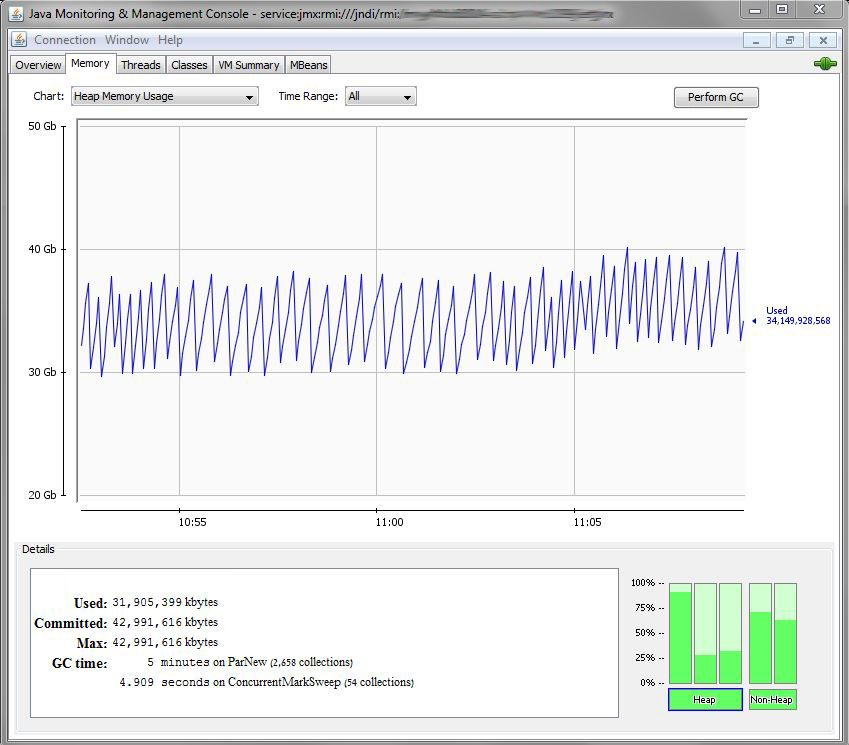
It turns out that Jenkins (under Jetty service) slowly "eats" the server memory. It's takes about 24 hours to take all the memory allocated to Jenkins (42GB). See the snapshots with examples...
TEST #1 on LTS 1.509.4:
1. Machine with Jetty up after restart
2. Jenkins Used - After one Hour: 22GB
3. Jenkins Used - After 12 Hours: 27GB
4. Jenkins Used - After 20 Hours: 35GB -> Memory leaks between 10:00-10:20 as you can see after GC it's still think Java in-use and fail to cleanup the all memory as it should be.
5. Jenkins Used - After 23 Hours: 39GB -> Very slow response and Heap is almost 100%
TEST #2 on LTS 1.509.4:
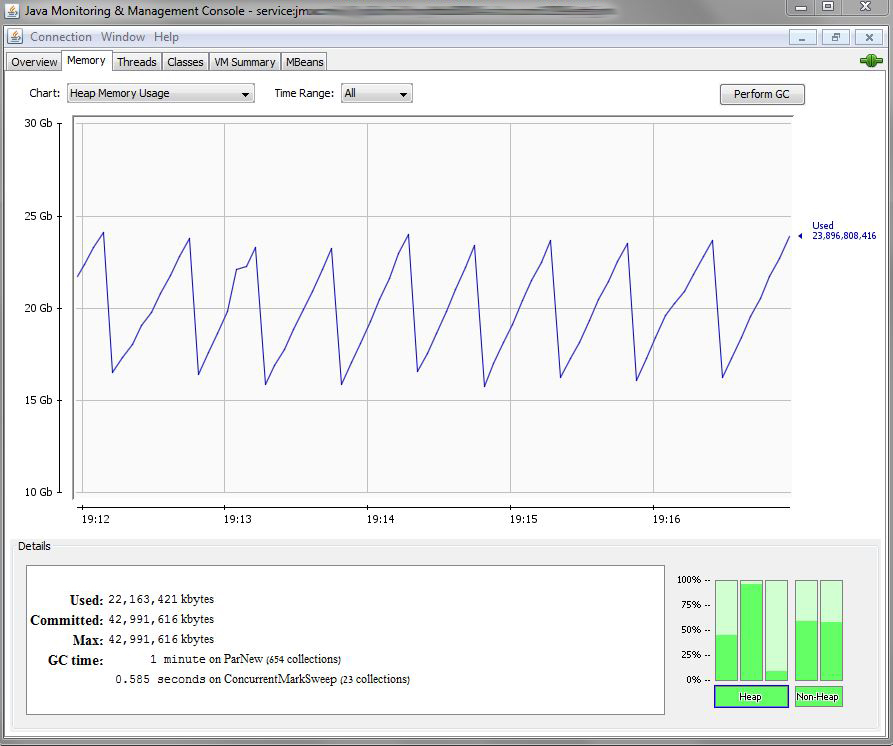
I tried to do manual GC, Doesn't help!
(see attach file: "Monitor_Memory_Over_Time_Manual_GC")
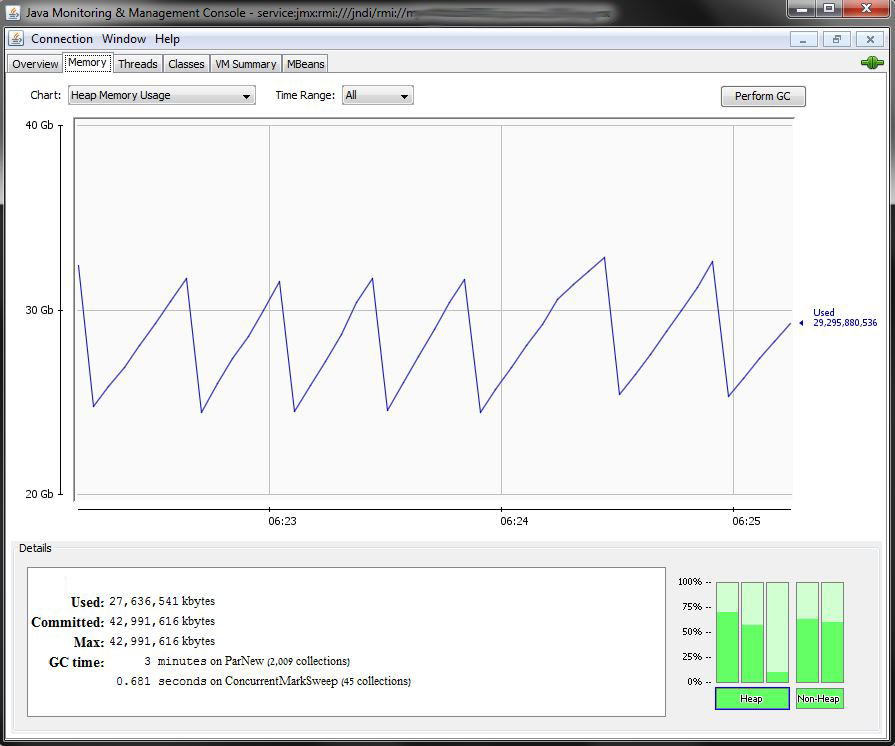
TEST #3 on LTS 1.509.3:
Unfortunately I downgrade to LTS 1.509.3 because of the memory leak, for me it's a blocker issue!
Please note that on version LTS 1.509.3 Jenkins works stable even on high environment without any memory leak... (See attach files: "Good_GC_A1.509.3" and "Good_GC_B1.509.3") but unfortunately there is a BIG unsolved problem/bug in this version, I can't rename jobs (Deadlock! which solved on the next version LTS 1.509.4/1.532.1 that I can't use because of the memory leak).
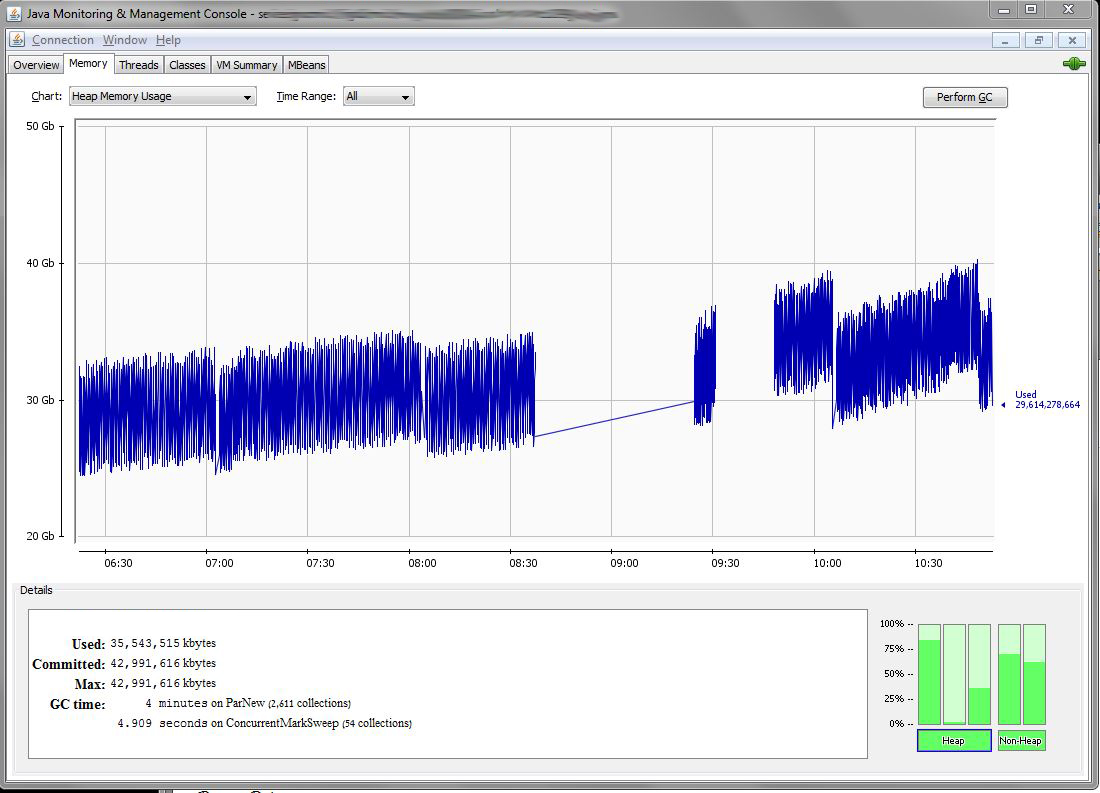
TEST #4 with LTS 1.532.1:
Same issue! Jenkins stuck with 100% memory usage after only 12 hours!
Thank You,
Ronen.