Uploaded image for project: 'Jenkins'
  1. Jenkins
  2. JENKINS-29736

History chart duration is wrong

XMLWordPrintable

    • Icon: Bug Bug
    • Resolution: Fixed
    • Icon: Minor Minor
    • junit-plugin
    • 1.617

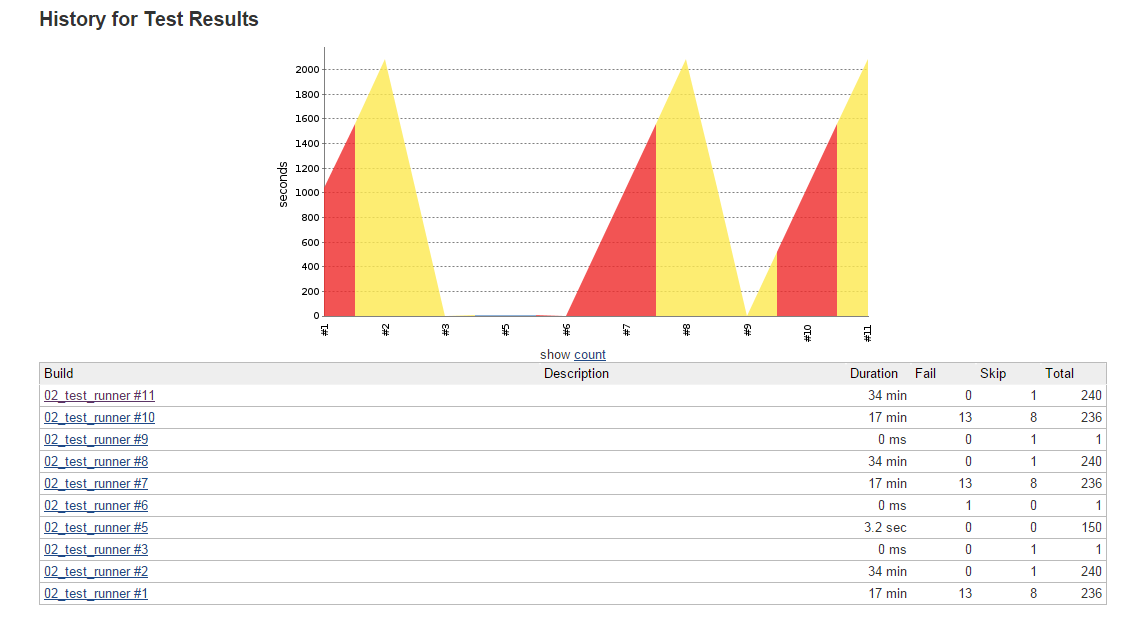
      On the history chart of test results, the duration displayed on the Y axis is not correct, as you can see in the below image:

      In function getDisplayGraph() in History.java file line 114, removing divide by 1000 solves the problem.

      Replacing line
      data.add(((double) o.getDuration()) / (1000), "", new ChartLabel(o) {
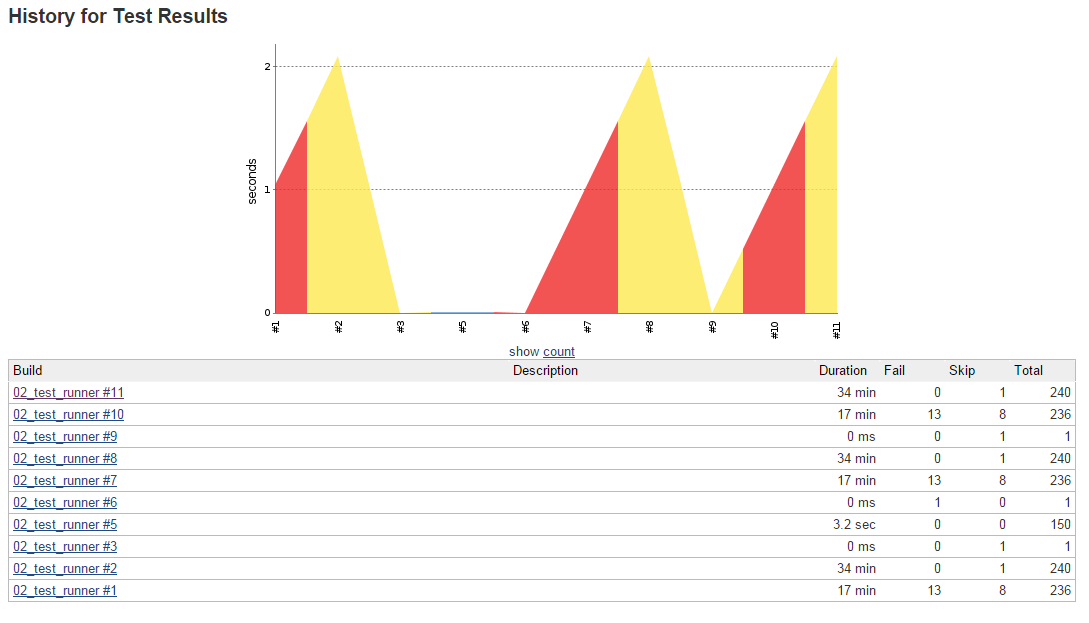
      with:
      data.add(((double) o.getDuration()), "", new ChartLabel(o) {
      results in this chart:

        1. Capture_after.PNG
          Capture_after.PNG
          54 kB
        2. Capture_before.PNG
          Capture_before.PNG
          50 kB
        3. testresults.png
          testresults.png
          77 kB

            igut Iosif Gut
            igut Iosif Gut
            Votes:
            0 Vote for this issue
            Watchers:
            4 Start watching this issue

              Created:
              Updated:
              Resolved: