-
Task
-
Resolution: Unresolved
-
 Major
Major
-
None
-
-
tasman, frank, christmas
Problem
When I upload a PR to GitHub and Jenkins responds with something bad and I click on details;
In the traditional UI I get to the build page where I with a quick glance can most of the time directly see what is wrong, wether it's a test case that has failed or a checkstyle or findbugs violation etc.
With BO I first get a blank page that load a bunch of stuff, compared to the traditional UI it takes forever, and during that load time I would have already found the culprit. And then I get a page that from my perspective shows me nothing except for a yellow color indicating an unstable build, but I sort of already knew that. And then I need to click around to find out what is wrong. While in the traditional build page I only need to click something to find out the details of why a particular thing is wrong.
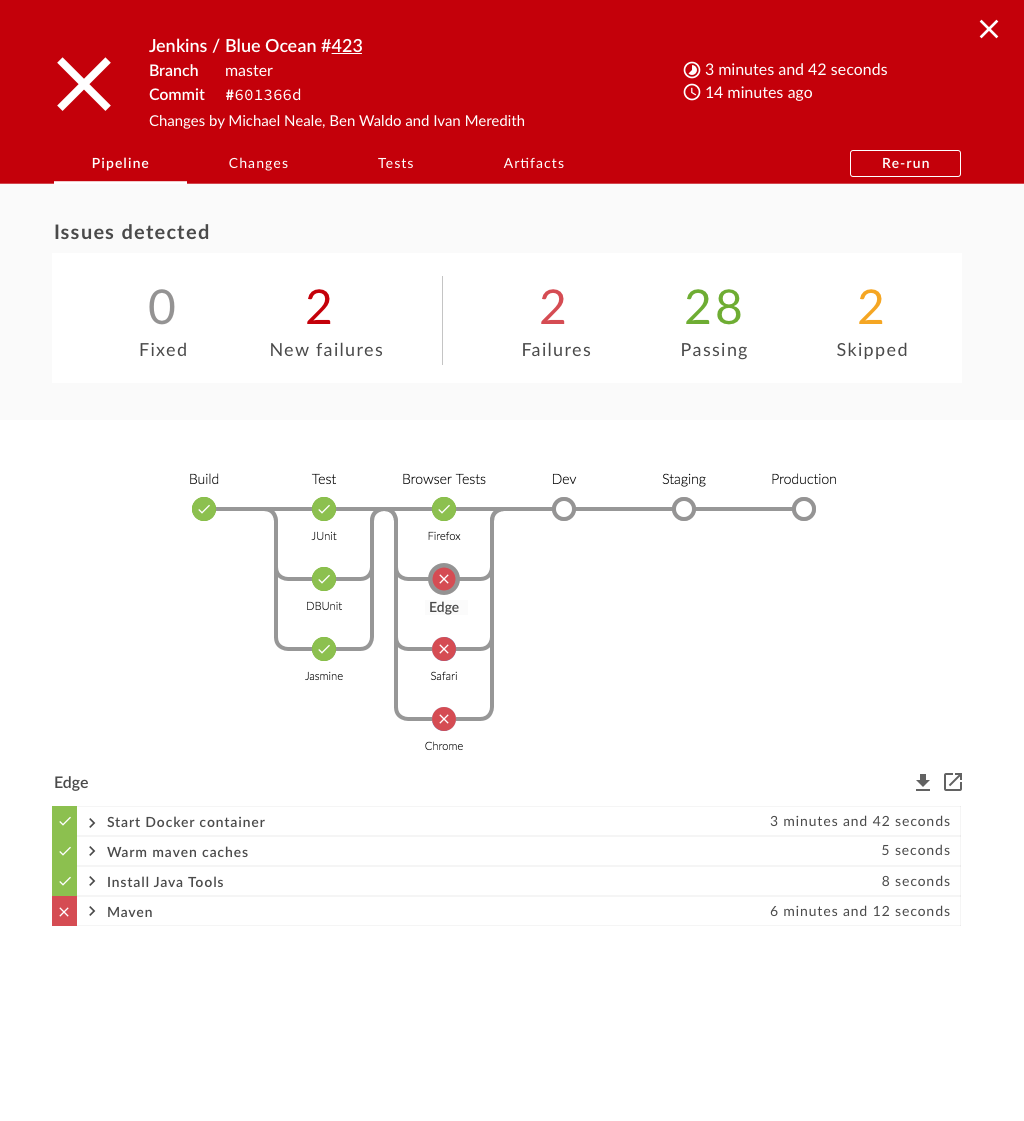
Possible solution
- When we detect that tests that have failed (or another analysis that is the cause of a failed run) the log is not expanded and the "Issues detected" panel appears at the top of the screen.
- Developer can click on the summary information in the issues detect and jump into analysis
- relates to
-
JENKINS-36340 Developer should see the Tests tab first if the failure is due to tests
-

- Resolved
-
-
JENKINS-46951 Show test summary on main results page
-

- Resolved
-
- links to