-
New Feature
-
Resolution: Fixed
-
 Minor
Minor
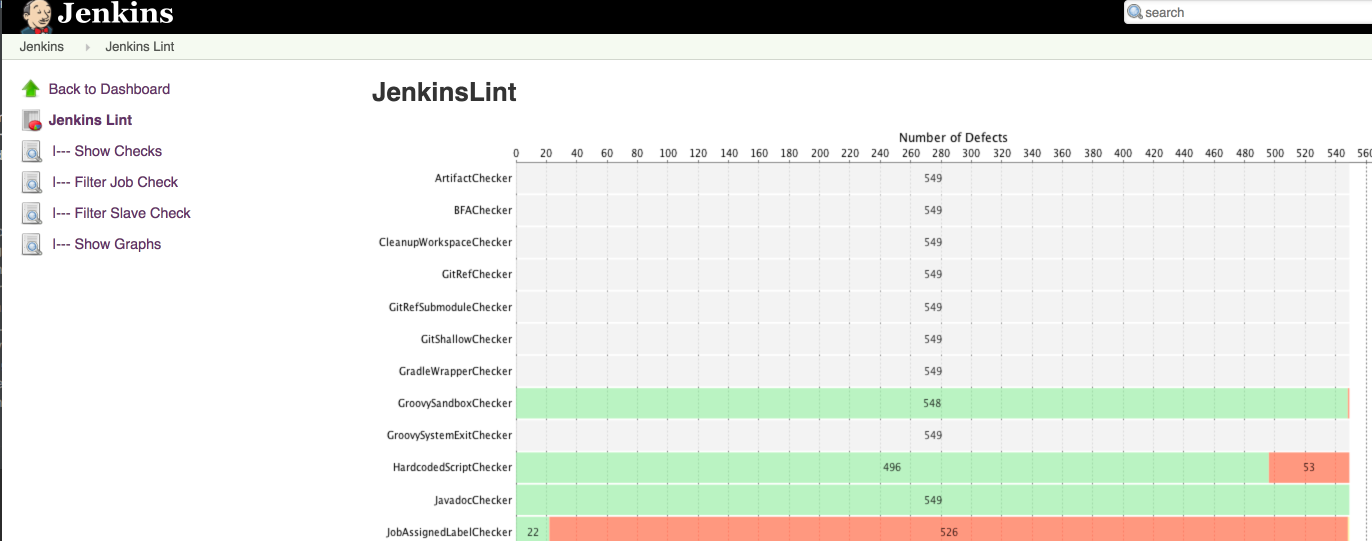
Let's now visualise a bit better the overall view using Bars and other kind of JFreeCharts which might help to take a draft view about how the Jenkins instance looks like from the lint point of view.

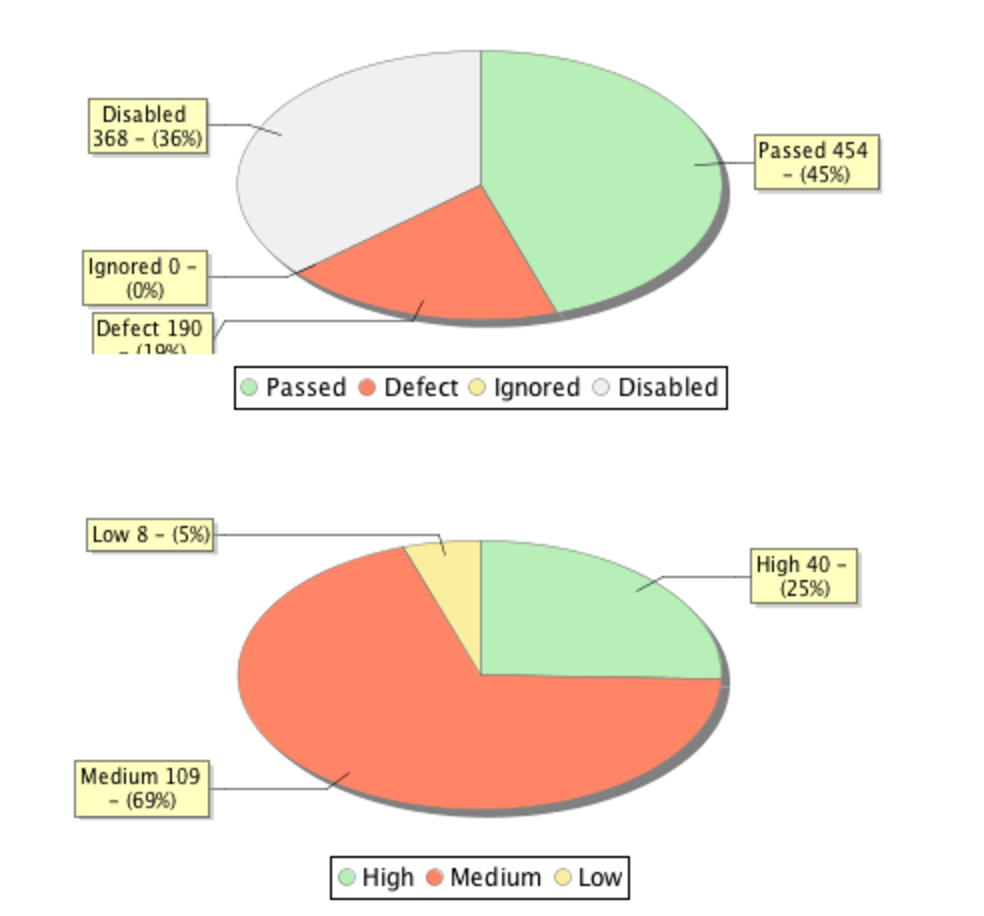
And with something like a pie Chart to show the total number of defects per status and likely per severity: