-
Bug
-
Resolution: Unresolved
-
 Minor
Minor
-
Jenkins 2.73.3, Blue Ocean 1.5.0
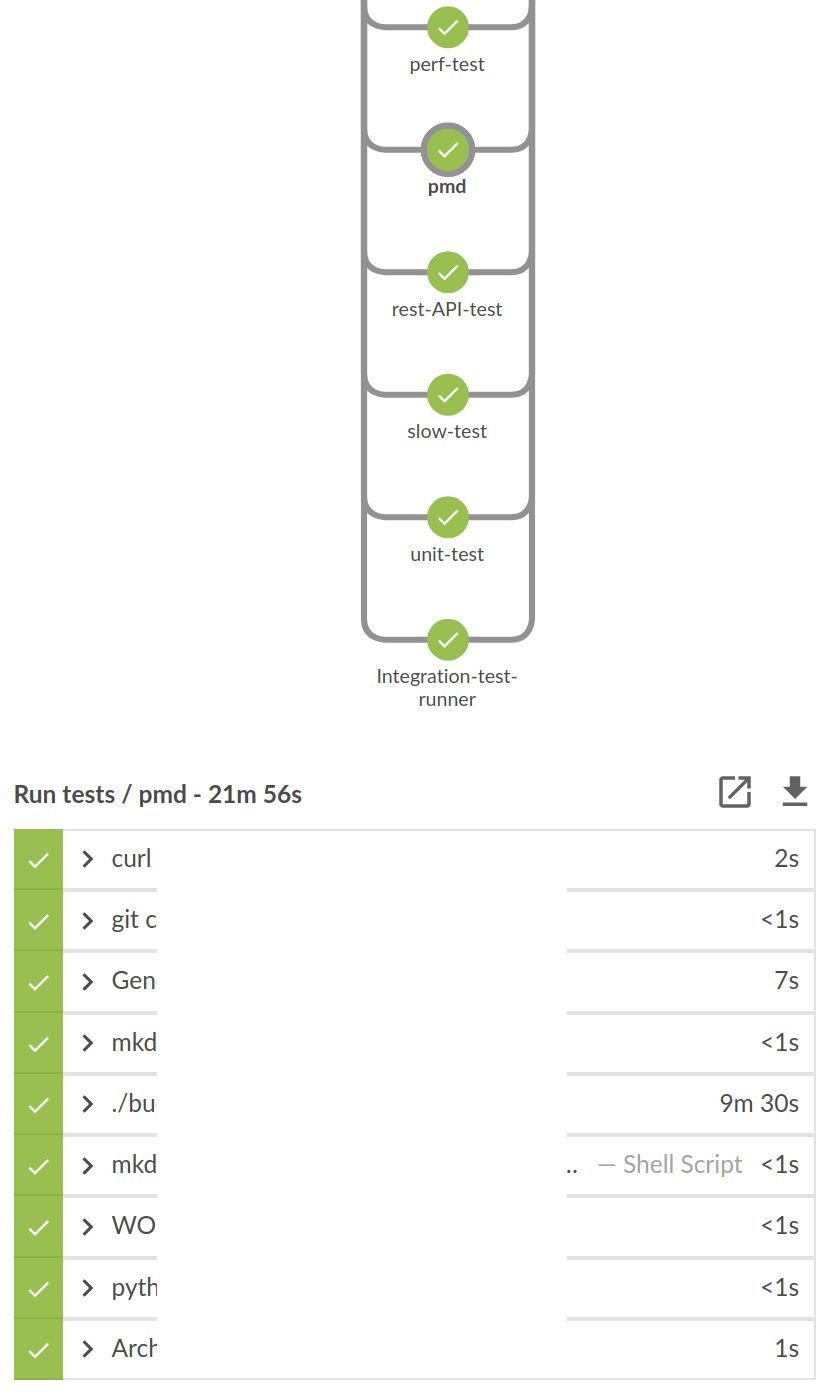
Current behavior:
In Blue Ocean, during a parallel block, the runtime reported for each individual step is reported as the max time of any step within the block, rather than its actual runtime. This reminds me of https://issues.jenkins-ci.org/browse/JENKINS-38536, which was supposedly fixed.
For example, in the screenshot, the total time of the "pmd" step should have been < 10 minutes, but it's reported as 21m56s. 21m56s is actually the runtime of the "Integration-test-runner" step (not shown). Every other step in the parallel block also reports a 21m56s runtime, despite their lesser runtimes.
Parallel step runtimes are also incorrectly reported in the Blue Ocean REST API, which is my actual problem—we're trying to do analytics on step runtimes, and can't do so because they're incorrect.
The times are correctly reported in, say, the pipeline plugin (/flowGraphTable), but not in Blue Ocean.
Desired behavior:
Correctly display the runtime of each parallel step.
- is duplicated by
-
-
- Resolved
-
