-
Task
-
Resolution: Fixed
-
 Major
Major
-
None
On cucumber, I noticed that there are a large number of postgres processes running around with ps output showing something like this:
root@cucumber:/var/log/apache2# ps -ef | grep post
postgres   931   998  0 12:02 ?        00:00:04 postgres: mirrorbrain mirrorbrain 127.0.0.1(44778) idle
postgres   998     1  0  2011 ?        00:07:54 /usr/lib/postgresql/8.4/bin/postgres -D /var/lib/postgresql/8.4/main -c config_file=/etc/postgresql/8.4/main/postgresql.conf
postgres  1030   998  0  2011 ?        00:03:41 postgres: writer process
postgres  1031   998  0  2011 ?        00:01:59 postgres: wal writer process
postgres  1032   998  0  2011 ?        00:02:48 postgres: autovacuum launcher process
postgres  1033   998  0  2011 ?        00:11:28 postgres: stats collector process
postgres  7588   998  0 12:16 ?        00:00:00 postgres: mirrorbrain mirrorbrain ::1(58442) idle
postgres  7990   998  0 12:16 ?        00:00:00 postgres: mirrorbrain mirrorbrain ::1(58631) idle
postgres  7994   998  0 12:16 ?        00:00:00 postgres: mirrorbrain mirrorbrain ::1(58635) idle
postgres  7996   998  0 12:16 ?        00:00:00 postgres: mirrorbrain mirrorbrain ::1(58639) idle
postgres  7999   998  0 12:16 ?        00:00:00 postgres: mirrorbrain mirrorbrain ::1(58661) idle
postgres  8009   998  0 12:16 ?        00:00:00 postgres: mirrorbrain mirrorbrain ::1(58662) idle
postgres  8075   998  0 12:16 ?        00:00:00 postgres: mirrorbrain mirrorbrain ::1(58722) idle
postgres  8079   998  0 12:16 ?        00:00:00 postgres: mirrorbrain mirrorbrain ::1(58726) idle
postgres  8168   998  0 12:17 ?        00:00:00 postgres: mirrorbrain mirrorbrain ::1(48148) idle
postgres  8181   998  0 12:17 ?        00:00:00 postgres: mirrorbrain mirrorbrain ::1(48498) idle
postgres  8225   998  0 12:18 ?        00:00:00 postgres: mirrorbrain mirrorbrain ::1(49804) idle
postgres  8266   998  0 12:19 ?        00:00:00 postgres: mirrorbrain mirrorbrain ::1(51263) idle
postgres  8279   998  0 12:19 ?        00:00:00 postgres: mirrorbrain mirrorbrain ::1(51566) idle
postgres  8286   998  0 12:19 ?        00:00:00 postgres: mirrorbrain mirrorbrain ::1(51641) idle
postgres  8311   998  0 12:19 ?        00:00:00 postgres: mirrorbrain mirrorbrain ::1(52046) idle
postgres  8313   998  0 12:19 ?        00:00:00 postgres: mirrorbrain mirrorbrain ::1(52050) idle
postgres  8381   998  0 12:20 ?        00:00:00 postgres: mirrorbrain mirrorbrain ::1(52961) idle
postgres  8386   998  0 12:20 ?        00:00:00 postgres: mirrorbrain mirrorbrain ::1(53005) idle
postgres  8388   998  0 12:20 ?        00:00:00 postgres: mirrorbrain mirrorbrain 127.0.0.1(39663) idle
postgres  8399   998  0 12:20 ?        00:00:00 postgres: mirrorbrain mirrorbrain ::1(53548) idle
postgres  8404   998  0 12:20 ?        00:00:00 postgres: mirrorbrain mirrorbrain ::1(53761) idle
postgres  8408   998  0 12:20 ?        00:00:00 postgres: mirrorbrain mirrorbrain ::1(53805) idle
postgres  8409   998  0 12:20 ?        00:00:00 postgres: mirrorbrain mirrorbrain ::1(53806) idle
postgres 31053   998  0 11:45 ?        00:00:00 postgres: mirrorbrain mirrorbrain 127.0.0.1(41433) idle
postgres 31056   998  0 11:45 ?        00:00:00 postgres: mirrorbrain mirrorbrain 127.0.0.1(41442) idle
Postgres apparently have some built-in throttling mechanism to restrict the total concurrent connections that can be served, and it appears to be around 100. As the number of these idle processes climb up, Drupal starts to fail indicating that the database connection had failed, and it renders the whole http://jenkins-ci.org/ unusable. I noticed this Drupal error last night, and a little investigation led to these idle processes.
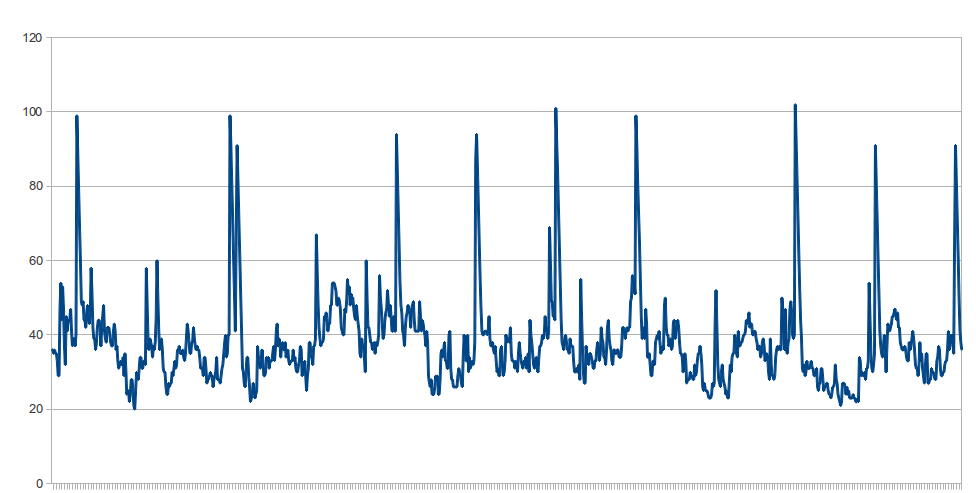
I've run a shell script that counts the # of idle processes every 10 seconds for past 3 hours, and created a chart out of it. As you see, about 10 times in the past 3 hours the # of processes spike up to the level dangerously close to the ceiling.
I think we need to investigate that before this becomes a major issue.