-
Bug
-
Resolution: Unresolved
-
 Major
Major
-
None
-
Jenkins 2.144, Workflow CPS Plugin 2.60, Job DSL Plugin 1.70
I have a pretty big system, 1000+ Jenkins items (mostly pipelines), 50+ slaves at all times.I'm investigating some high CPU issues after the upgrade to 2.144 (I've upgraded the plugins as well, so I doubt it's really Jenkins core).
What caught my eye is the following stacktrace (a few variations of it):
   java.lang.Thread.State: RUNNABLE
        at java.lang.String.valueOf(String.java:2994)
        at org.jenkinsci.plugins.workflow.cps.CpsFlowExecution.cleanUpGlobalClassValue(CpsFlowExecution.java:1345)
        at org.jenkinsci.plugins.workflow.cps.CpsFlowExecution.cleanUpLoader(CpsFlowExecution.java:1291)
        at org.jenkinsci.plugins.workflow.cps.CpsFlowExecution.cleanUpHeap(CpsFlowExecution.java:1265)
        at org.jenkinsci.plugins.workflow.cps.CpsThreadGroup.run(CpsThreadGroup.java:375)
        at org.jenkinsci.plugins.workflow.cps.CpsThreadGroup.access$200(CpsThreadGroup.java:83)
        at org.jenkinsci.plugins.workflow.cps.CpsThreadGroup$2.call(CpsThreadGroup.java:244)
        at org.jenkinsci.plugins.workflow.cps.CpsThreadGroup$2.call(CpsThreadGroup.java:232)
        at org.jenkinsci.plugins.workflow.cps.CpsVmExecutorService$2.call(CpsVmExecutorService.java:64)
        at java.util.concurrent.FutureTask.run(FutureTask.java:266)
        at hudson.remoting.SingleLaneExecutorService$1.run(SingleLaneExecutorService.java:131)
        at jenkins.util.ContextResettingExecutorService$1.run(ContextResettingExecutorService.java:28)
        at jenkins.security.ImpersonatingExecutorService$1.run(ImpersonatingExecutorService.java:59)
        at java.util.concurrent.Executors$RunnableAdapter.call(Executors.java:511)
        at java.util.concurrent.FutureTask.run(FutureTask.java:266)
        at java.util.concurrent.ThreadPoolExecutor.runWorker(ThreadPoolExecutor.java:1149)
        at java.util.concurrent.ThreadPoolExecutor$Worker.run(ThreadPoolExecutor.java:624)
        at java.lang.Thread.run(Thread.java:748)
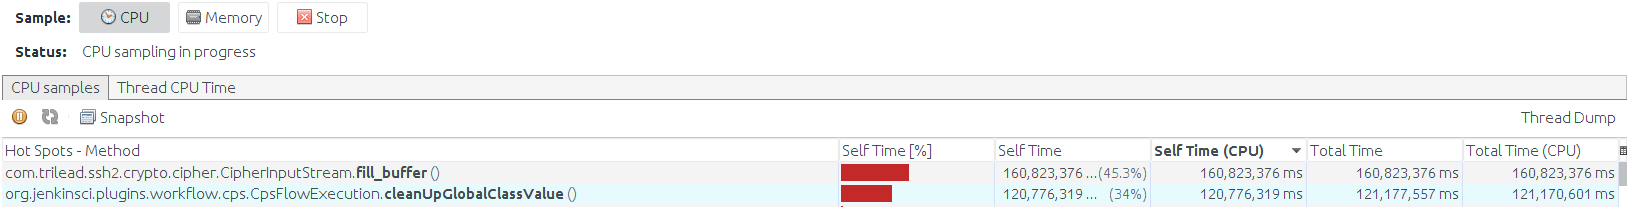
jvisualvm is reporting over 60% Self Time (CPU) in cleanUpGlobalClassValue and it looks like the offender is CpsFlowExecution.java:1345
LOGGER.log(Level.FINEST, "ignoring {0} with loader {1}", new Object[] {klazz, /* do not hold from LogRecord */String.valueOf(encounteredLoader)});
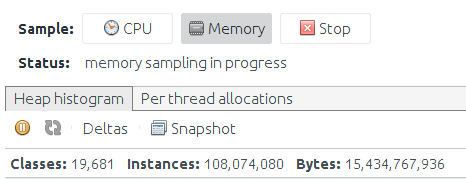
jvisualvm was also reporting 300k loaded classes at that time. I presume the encounteredLoader is huge.
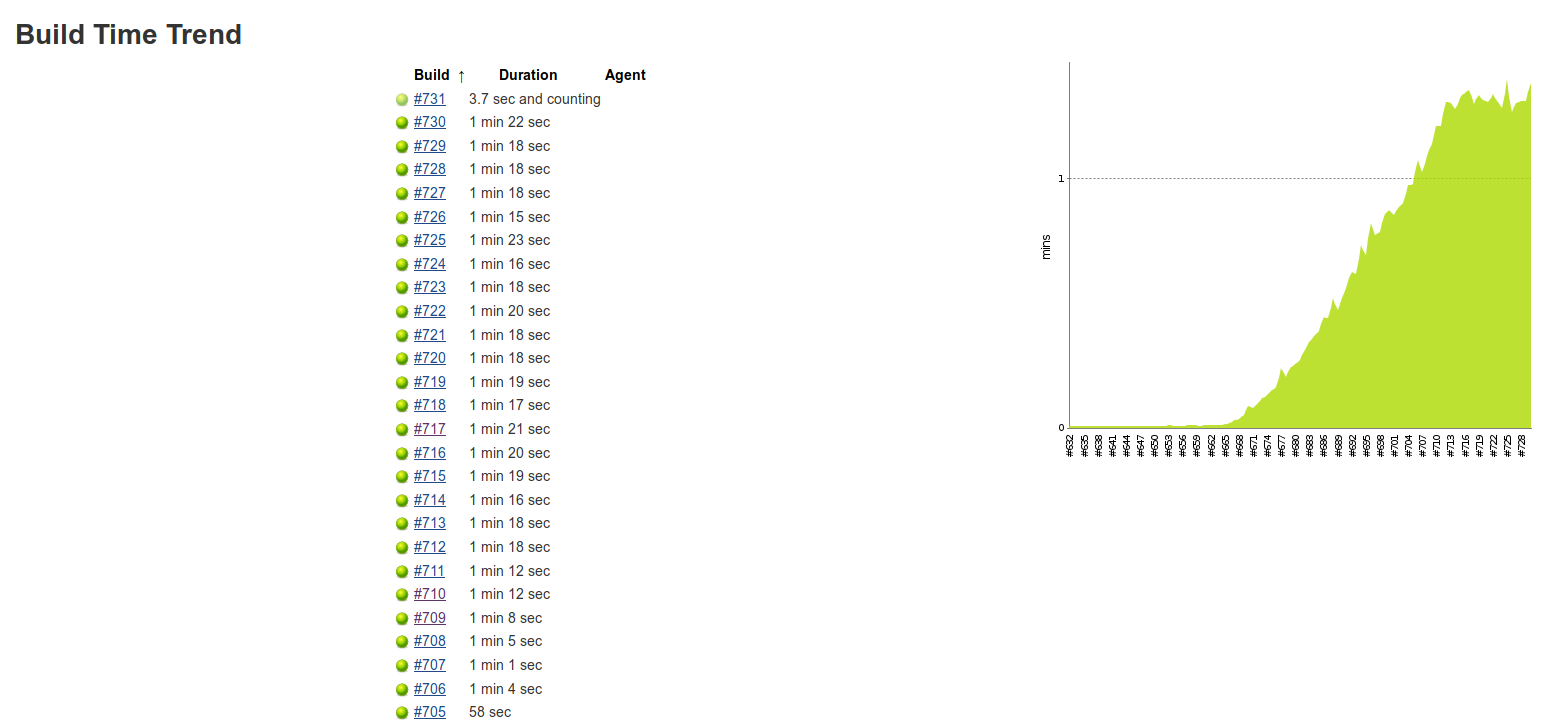
I've made a patch for myself, removing the line, it will take me a few days to confirm if this remedies the issue - the count of total loaded classes goes up over time and it will take 2-3 days to get back to 300k. I still don't know if that's an issue by itself. Initial observations show that it's the DSL Plugin that runs several times a day that's responsible for the spikes in the metric.