-
Bug
-
Resolution: Unresolved
-
 Major
Major
-
None
-
windows
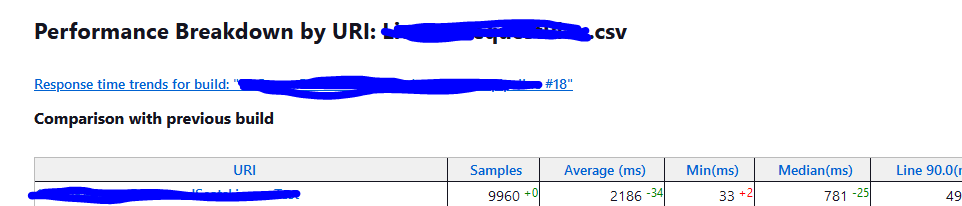
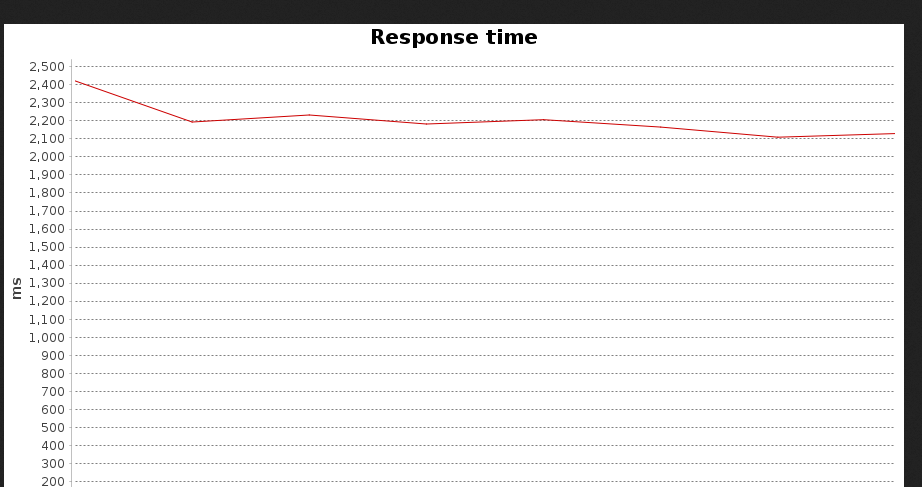
Responding Time Graph is not displayed for performance report when pipeline commands used for the plugin even the showTrendGraphs is set to true.
The link of the graph exists. But it is not displayed on the performance report view. See screenshot
Usage:
perfReport errorFailedThreshold: 70,
                  errorUnstableResponseTimeThreshold:'LoadTokenGenerationTest.jtl:10',
                errorUnstableThreshold: 69, filterRegex: '',
                showTrendGraphs: true,
                sourceDataFiles: .............


