-
Bug
-
Resolution: Unresolved
-
 Major
Major
-
None
-
Jenkins Version 2.440.1
JaCoCo plugin 3.3.5
CONTEXT:
We have multi-module projects and need to create reports for each module and also be able to assign different thresholds for different modules.
We use the next pipeline's stage for this purpose:
stage('Jacoco Code Coverage') {
    steps {
        script {
            jacocoConfigs.each {jacocoConfig ->
                jacoco(
                    execPattern: jacocoConfig.key + '/build/jacoco/*.exec',
                    classPattern: jacocoConfig.key + '/build/classes/java/main',
                    sourcePattern: jacocoConfig.key + '/src/main/java',
                    exclusionPattern: jacocoConfig.value.exclusionPattern,
                    changeBuildStatus: true,
                    runAlways: true,
                    minimumInstructionCoverage: jacocoConfig.value.minimumInstructionCoverage,
                    maximumInstructionCoverage: jacocoConfig.value.maximumInstructionCoverage,
                    minimumBranchCoverage: jacocoConfig.value.minimumBranchCoverage,
                    maximumBranchCoverage: jacocoConfig.value.maximumBranchCoverage,
                    minimumComplexityCoverage: jacocoConfig.value.minimumComplexityCoverage,
                    maximumComplexityCoverage: jacocoConfig.value.maximumComplexityCoverage,
                    minimumLineCoverage: jacocoConfig.value.minimumLineCoverage,
                    maximumLineCoverage: jacocoConfig.value.maximumLineCoverage,
                    minimumMethodCoverage: jacocoConfig.value.minimumMethodCoverage,
                    maximumMethodCoverage: jacocoConfig.value.maximumMethodCoverage,
                    minimumClassCoverage: jacocoConfig.value.minimumClassCoverage,
                    maximumClassCoverage: jacocoConfig.value.maximumClassCoverage
                )
            }
        }
    }
}
Here: jacocoConfig.key - a name of a module, jacocoConfig.value - map of parameters for Jacoco
EXPECTED RESULT:{}
Correct logs for each module after each jacoco() execution. Code Coverage Trend on UI for each module.
ACTUAL RESULT:
The logs are correct. We see jacoco() execution for each project module. Different thresholds are applied for each module correctly. However, we see the same Code Coverage Trends on UI. And it looks like the Trend for the last scanned module (even not the trend for all lines in the project). We see around 40 covered and 15 missed lines here:
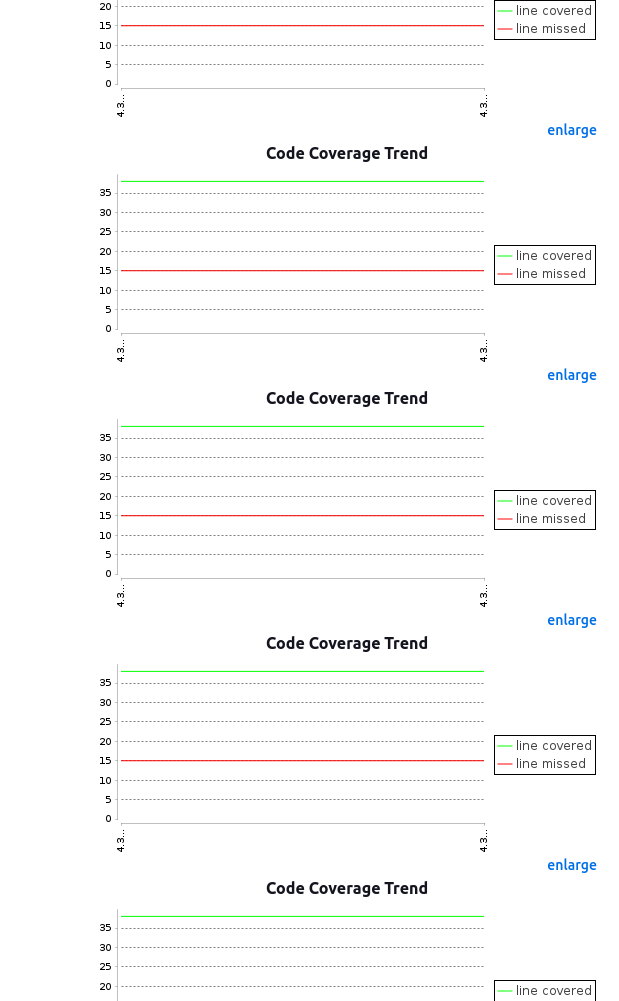
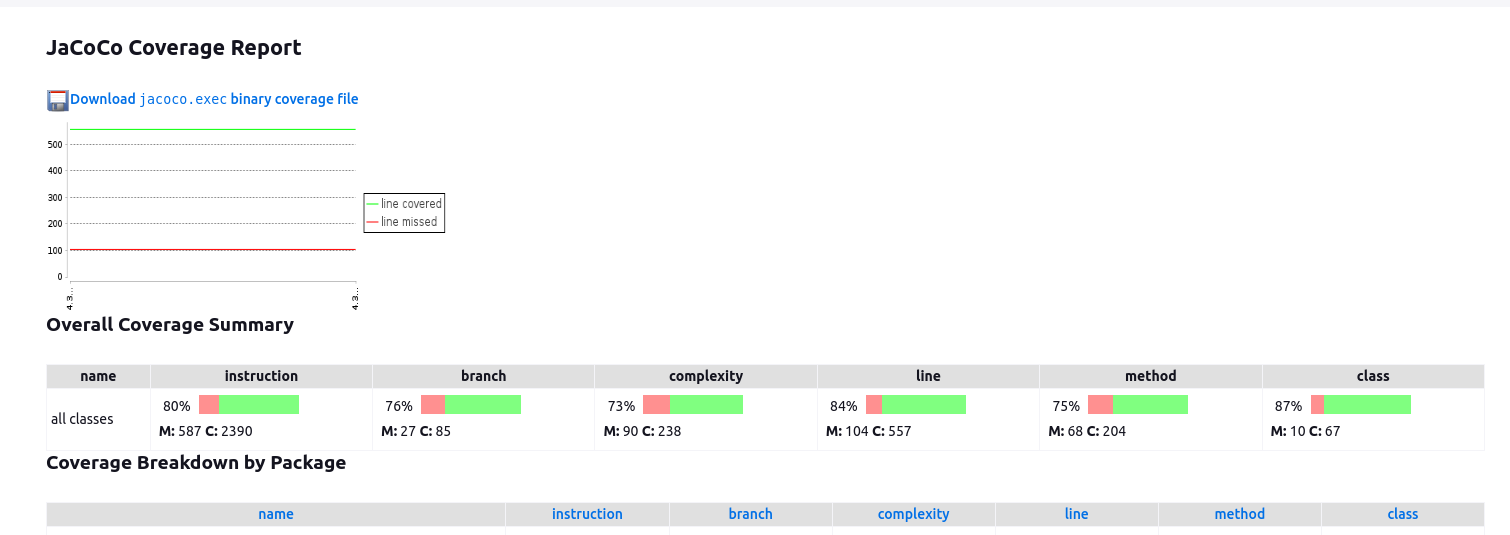
If we click on one of the trends, it always leads us to the same report about the whole project (jenkins_url/job_path/lastBuild/jacoco/). We see here around 550 covered lines and 100 missed in the whole project in total:
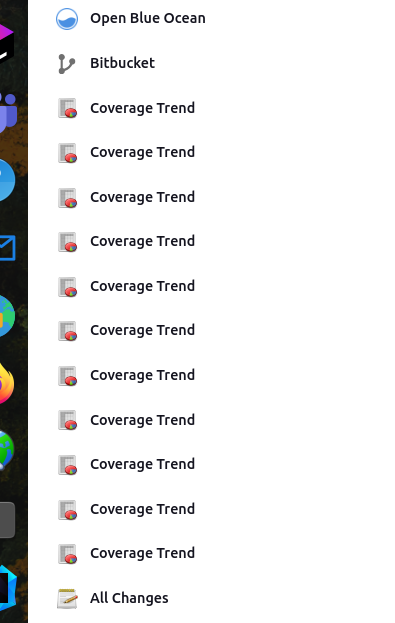
We also see redundant Coverage Trend's icons for all modules on the left:

I also reproduced it on local Jenkins easily. I installed only LTS Jenkins 2.440.1 and JaCoCo plugin 3.3.5 for it.